Tryon: Wages, Population Stagnant; City Taxes And Utilities Up
With the City of Great Falls moving past the financial fiasco of the $5,553,054 bailout (decrease in unassigned General Fund balance) in 2013 to cover the electric power business (see City 2014 CAFR Financial section, p. 14), the City’s financial position has improved, but the needs of the City are still great.
The façade of the Civic Center needs fixing. It’s a big ticket item and the money has to come from somewhere. City staff reports that costs to repair the Civic Center are estimated in the $6 – 8 million dollar range.
City officials are also discussing a “need” to increase legal staff and increase staff workspace. And then there is the recently passed Park and Recreation Master Plan, which cost the City $89,970 to produce, as reported in October of 2015.
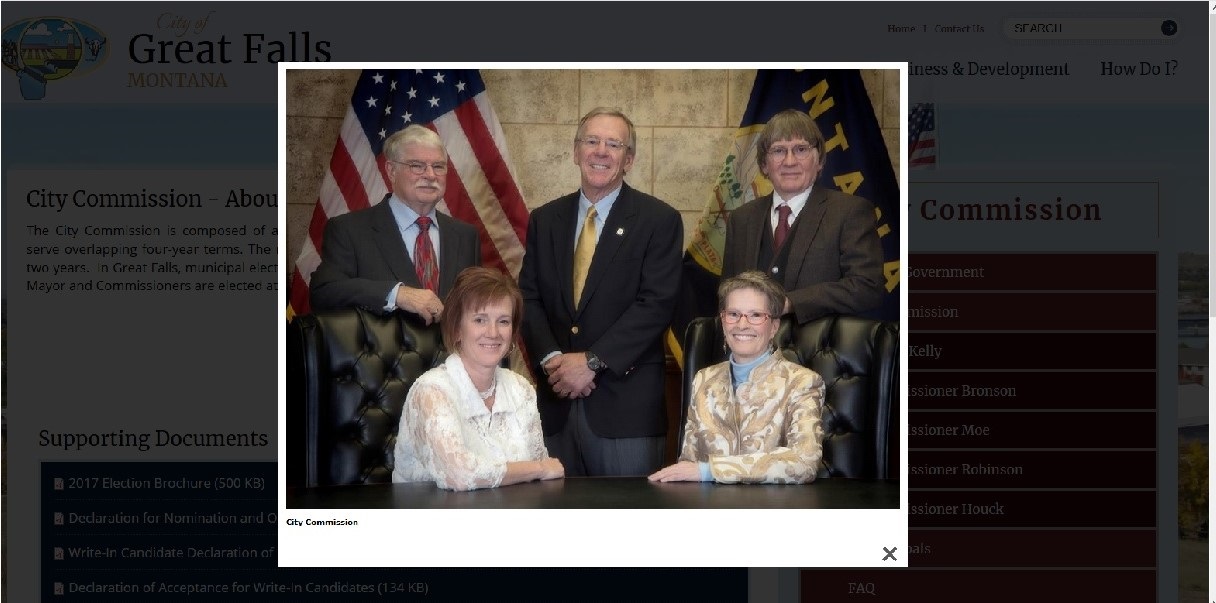
As E-City Beat reported on February 17, from the City Manager’s packet: “After discussion about implementation of the Park Master Plan, it was the consensus of the Commission to pursue a Park Maintenance District, but agreed that the fees imposed should be reasonable and not include golf or the Natatorium. Manager Doyon suggested that a more robust maintenance fee may result in more money in the general fund to support public safety and ultimately less cost to the public versus a public safety levy. The Commission concurred.”
Manager Doyon gets it: how far can we stretch our property tax dollars? How many more increases, beyond the ever-seeking public school administration and the Great Falls Development Authority, can fixed income and lower income families bear?
The City routinely raises annual property taxes under the inflationary percentage allowed by State law, which is one-half of the average rate of inflation for the prior 3 years. For the 2016-17 budget year, that rate was .67 percent. Here is a brief description of the 198.24 mill levy passed by the City Commission for the budget year 2016-17, as taken from Resolution 10152:
Section 1. – Determination of Mill Levy Limit
- Appendix A shows the determination of the total mill levy limit of 167.26 mills.
- An additional 26.14 “Permissive Medical Levy” is allowed under 15-10-420(9)(a)(vi) for increased health insurance premiums not included in the Appendix A calculation.
- An additional 1.90 mills is allowed under 15-10-420(2) for additional voter supported mills. On November 4, 2003, a $2.5 million general obligation bond was approved by voters for construction of a soccer park. It has been determined that 1.90 mills for soccer park debt service payments is needed for Fiscal Year 2017.
- Lastly, an additional 2.94 mills is allowed under 15-10-420(2) for additional voter supported mills. On November 7, 2006, a $2.27 million general obligation bond was approved by voters for repair and improvement of city pool facilities. It has been determined that 2.94 mills for swimming pool debt service payments is needed for Fiscal Year 2017.
The 20-year soccer park bonds were issued in June 2004. The 10-year pools facilities bonds were issued in May 2007, expiring after this year.
To provide a snapshot of yearly property tax levies, here is a rundown for Great Falls over the past 7 years (information from annual property tax increase and mill levy requests to City Commission):
Year | Base Mill Levy | Permissive
Med Levy |
Soccer Park | Pools Facilities | TOTAL | Base Inflationary % increase taken | Perm
Med Infl % |
2010-11 | 152.94 | 15.54 | 2.45 | 3.83 | 173.10 | 0 | 1.06 |
2011-12 | 164.27 | 15.44 | 2.56 | 3.72 | 183.24 | 0 | 0? |
2012-13 | 169.13 | 17.93 | 2.58 | 3.93 | 193.57 | 1.2 | 1.4 |
2013-14 | 172.19 | 20.06 | 2.57 | 3.92 | 198.74 | 1.03 | 1.3 |
2014-15 | 175.77 | 22.87 | 2.82 | 3.62 | 205.08 | 1.03 | 1.25 |
2015-16 | 162.17 | 23.03 | 1.97 | 3.12 | 190.29 | .67 | 2.17 |
2016-17 | 167.26 | 26.14 | 1.90 | 2.94 | 198.24 | .5 | 2.48 |
The base mill levy is a formula regulated by the State under MCA 15-10-420. A portion of that code reads:
“The maximum number of mills that a governmental entity may impose is established by calculating the number of mills required to generate the amount of property tax actually assessed in the governmental unit in the prior year based on the current year taxable value, less the current year’s newly taxable value, plus one-half of the average rate of inflation for the prior 3 years.
(b) A governmental entity that does not impose the maximum number of mills authorized under subsection (1)(a) may carry forward the authority to impose the number of mills equal to the difference between the actual number of mills imposed and the maximum number of mills authorized to be imposed. The mill authority carried forward may be imposed in a subsequent tax year.”
The result of the mill levy increase over the years results in a continual increase by the City in property taxes with the exception of 2015-16. And while the base mill levy for this year, 2016-17, is just under the rate of 2013-14, property taxes have increased with increases in streets, lighting districts, the boulevard district and the permissive medical levy. It is evident by the statistics on the permissive medical levy that government regulation of the health care industry has done nothing to stop the rising costs of medical care and insurance, an issue both the public school system and the county are also dealing with.
Additionally to property taxes, city utility rates have increased each year. While these increases may be necessary to maintain critical infrastructure, many citizens in this town do not get cost of living increases or annual raises, and often work two or three jobs to make ends meet. Increases in taxes and services for them means a decrease in other household spending.
To provide a snapshot of just one area of yearly increases, here are the basic utility service increases for Great Falls over the past 7 years and this year’s proposed increases (information taken from annual utility rate increase requests to City Commission):
2010: water 5%; sewer 7.5%
2011: water 5%; sewer 7.5%
2012: water nearly 5%; sewer nearly 10%
2013: water 5%; sewer 10%
2014: water 5%
2015: water 7%; sewer 3%; storm drain 10%.
2016: water 10%; sewer 3%; storm drain 10%
2017 (proposed) water 10%; sewer 3%; storm drain 10%
You get the picture. Are utility increases now a standard and a FOREVER thing? And when did these annual rate increases actually begin? Are we trying to outclass other cities in Montana with our rates? The conundrum is that infrastructure in communities across America is aging, is costly to repair and update, and is becoming more costly with federal regulations.
The City Commission set a public hearing date of May 2, 2017 to address the proposed utility increases for this year to be effective in June. There would be public outcry if the same annual increases were applied to gas and electric rates.
Take a drive around areas of town in the summer and you see more and more dried up lawns. Seniors and low income families water their lawns less as the cost of water services increase.
The answer to the tax dilemma is complicated. Taxes and utility fees are a necessary component of suburban living. In comparing the tax climate of Great Falls to other major Montana cities, Great Falls appears to be reasonable in how much taxes are levied on the average homeowner.
What Great Falls really needs is an expanding tax base to ease the burden on individual property owners. That means more and better paying jobs. The more property owners and business owners there are to spread the wealth of tax burden, the less impact tax increases have on each individual. The more TIFs and tax breaks given to select projects, the more the average Joe tax payer has to provide for every aspect of the community, city, schools and county included.